EOG Resources
Industry Overview - Exploration & Production
The E&P industry is responsible for searching for, extracting, and selling oil and gas to the global economy. Companies in this industry supply one of the most important input products to the economy as oil and natural gas are still the most important source of energy in most regions. This industry is also referred to as upstream because it sits furthest from the end-user of the refined oil product, as opposed to downstream companies who refine the oil and market their fuel products such as diesel, gasoline, and heating oil to different consumers. Integrated oil companies compete across the entire oil supply chain by extracting, refining, and marketing their own oil products.
The demand for oil is driven by global macroeconomic variables such as population growth, productivity growth, and increasing economic prosperity. As currently under-developed countries become increasingly wealthy their demand for energy and thereby their demand for oil increases. The supply of oil, on the other hand, is finite and largely depends on technological continuous capital expenditures to access new oil fields or technological advancements such as hydraulic fracturing (fracking) to more efficiently extract oil out of places that were previously too difficult and costly to access. Over the short to medium-term, supply is determined by the price that the E&Ps estimate they can sell their product for and by their subsequent amount of capital expenditures (or lack thereof) into new oil rigs. The oil market has been observing constrained supply as companies have withheld capital expenditures during the COVID-19 pandemic and are only slowly investing in new production facilities, meaning that oil production would not be able to match an unexpected increase in global oil demand. The short-term supply of oil, and therefore prices, are also largely influenced by the OPEC cartel (14 countries controlling roughly 40% of global oil production), which coordinates the amount of oil its member countries produce per day to achieve a desired price level for the commodity.
Oil is a commodity and as such the industry is fiercely competitive because companies are unable to differentiate their product from their competitors and therefore can only compete on price. A sustainable competitive advantage can only be achieved by becoming a low-cost producer through strict cost management programs, increased productivity from better drilling technology, or economies of scale.
The industry is heavily regulated by various national and local governments requiring safe, and responsible oil extraction with minimal damage to the environment. Taxing or fully controlling oil production may also be the largest source of income for certain governments such as Saudi Arabia and the UAE. Regulation has increased over the past decades as public policy has encouraged low-carbon, renewable energy sources such as wind and solar power, while increasingly penalizing high-carbon fossil fuels via new carbon taxes. As renewable energy sources become more competitive substitute products to oil it is likely that the E&Ps will lose some of their demand to this new industry over the very long-term.
Company Overview
EOG Resources is one of the largest independent oil and gas companies in the United States. Nearly all of its operations are conducted inside the country with only a small share of revenue coming from oil wells in Trinidad. The company’s core strategy is focused on becoming the lowest cost producer of oil in the U.S. which it pursues by advancing its cost-efficient horizontal drilling technology and expanding the number of its Double Premium wells to maximize shareholder returns.
For the fiscal year ending December 31, 2022, EOG’s proved reserves increased from 3,747 to 4,238 MMBoe comprised of 39% crude oil, 27% NGL, and 34% natural gas. Total production volumes were 908 MMBoe and are expected to rise approximately 9% in 2023.
EOG earned $25.70bn in revenue, benefitting from a surge in oil and gas prices. The average annual revenue for the past 5 years has been closer to $15bn although consensus currently expects oil prices, and therefore revenue, to remain elevated for the next two or three years. Over the past five years, the share of revenue from EOG’s core products has been within the following ranges:
Crude Oil and Condensate: 55-60%
Gathering, Processing and Marketing: 22-30%
Natural Gas: 7-11%
NGL: 5-10%
Gathering, processing, and marketing revenues are generated from sales of third-party crude oil, NGLs, and natural gas, as well as fees associated with gathering third-party natural gas and revenues from sales of EOG-owned sand. Marketing costs represent the costs to purchase third-party crude oil, natural gas, and sand and the associated transportation costs, as well as costs associated with EOG-owned sand sold to third parties.
Key Fundamentals
- Costs & Breakeven Prices
As mentioned above, EOG is competing in a commodity market, meaning that the only way to maintain a competitive advantage is by achieving cost leadership. EOG’s oil is inherently the same as any other competitor’s oil, which leaves customers indifferent between selecting whom to buy their oil from. The only difference from a customer perspective is the price they have to pay to get the oil. Therefore, E&Ps can only compete on cost and are forced to enforce a strict low-cost structure that minimizes the firm’s breakeven price of oil.
EOG has been one of the most cost-efficient oil producers in the US thanks to its advanced technologies used in its drilling operations, such as 3D seismic, core analysis microseismic tools. These tools allow EOG to lower its costs from dry-hole operations.
As of December 31, 2022, it cost EOG $21.16 to produce one Boe (including D&A) compared to $22.80 in 2021, $22.98 in 2020, and $23.54 in 2019, a clear downward trend in costs despite decade-high levels of inflation in 2021 and 2022, and is further expected to fall to $20.65 for 2023. Regarding its oil operations, the estimated breakeven price is between $35 and $40, giving it ample room to operate profitably should oil prices drop significantly.
- Return on Invested Capital
EOG has one of the highest hurdle rates in the industry, targeting at least 60% ATROR (After-Tax Rate of Return) to undertake new projects. Over a 5-year average, this has allowed EOG to provide the highest Return on Invested Capital to its shareholders compared to its direct competitors (see Peer Group comparison table below). Further, EOG currently holds the highest 5-year annualized growth rate in Return on Equity (RoE) not just among its peer group but across the entire Russell 3000 universe. Management’s focus on high hurdle rates, capital efficiency, and ambitious return on capital targets in nearly all of their communications are an important signal for us that EOG is likely to provide better returns than its peers for long-term shareholders.
- Operating History
A proven track record of stable operating history and effective cost management are important to us as they indicate a company’s ability to consistently return profits to shareholders and stay resilient even during periods of recession. A company that has not been able to turn a profit during the longest bull market in recent history would be a concerning investment opportunity as its survival during an economic downturn would be highly questionable.
Despite intense fluctuation in global oil and gas prices, EOG has proven in several years its ability to pay a continuous dividend to shareholders due to its superior low-cost structure. The company has consistently paid a dividend for over 30 years and has not once been forced to cut its dividend even during recessionary periods when the price of oil fell below 40$bbl, and even below $20bbl and revenues fell 36% in 2020. Instead, it has increased its dividend to $8.8 per share from just $0.03$ in 1991 (an increase of over 29,200%). Its effective cost management programs have allowed EOG to hold its EBITDA margin above 40% in all but two years in its corporate history.
- Long-Term Prospects
The long-term prospects for any company in the oil industry are incredibly difficult to forecast and over the very long-term (20+ years) likely to be entirely dependent on factors outside of any oil company’s control. The prospects of the oil industry depend on 1) how quickly countries with high greenhouse gas emissions transition to a carbon-neutral economy, and 2) how many years of supply of oil reserves are still left under Earth’s surface for companies to develop and sell. The former point hinges on the speed with which governments pass regulations such as carbon taxation or direct bans on certain drilling activities. Such regulations have already started to impact the industry in Europe and will only increase going forward. The transition to a carbon-neutral economy via renewable energy sources also poses a threat to the industry and is already a viable substitute product to fossil fuels in several countries. In response to this changing regulatory environment and push towards sustainable energy, many oil companies such as Chevron and Royal Dutch Shell have already launched their own business units focused on delivering alternative energy revenue streams to their business in a zero-carbon economy.
Although EOG has committed to reducing its carbon emissions to zero by 2040, it does not have a separate line of business to provide alternative revenue streams if the company were to exit the oil industry entirely. The company is focused on reducing its environmental footprint and making its operations “greener”. However, we find no indication of plans to prepare the company for a post-oil economy. This may pose a long-term risk to the going concern of the company if fossil fuels were to be banned sooner than expected. As long as the use of oil is not severely regulated, however, we are confident that EOG and other E&Ps have many highly profitable years (if not decades!) ahead of them, with material cash returns to shareholders in the future. The U.S. Energy Information Administration estimated in October 2021 that global energy companies would be able to the world’s growing demand for fossil fuels for another 30 to 40 years. This very conservative estimate serves as a floor, rather than a ceiling, as it does not speculate on the potential discovery of new fields in the future or the advancement of technology which would allow for more efficient drilling in existing fields. Such estimates regularly only account for currently proved reserves that are profitable for oil companies to bring up at current prices and technology levels while also assuming that no more additional oil fields will be discovered. While total oil supply is incredibly difficult to determine, more dynamic estimates that try to include improvements in oil production, range anywhere from 50 years to more than 100 years. From a pure supply-side perspective (and ignoring any further regulatory tightening), it seems unlikely that we as investors will experience the total depletion of global oil supply, even with a long-term investment horizon.
Regarding the short- to medium-term outlook, we note that the global oil market has been structurally undersupplied over recent years as companies have been reluctant to make necessary capital expenditures to expand their levels of oil production due to the uncertainties of the pandemic and an unfavorable policy outlook that might restrict the industry’s drilling operations. As the economy reopened and recovered from the pandemic and demand increased, the supply side has been slow to catch up as companies cannot increase output on short notice, encouraging Wall Street banks to predict that the currently small surplus in oil supply will fall back into deficit in the second half of 2023, benefitting oil prices. As such, the oil market is likely to remain structurally undersupplied over the medium-term.
Competitive Advantages
- Cost Advantage from Advanced Shale Technology
As mentioned throughout this article, EOG is a cost-leader in its industry due to its sophisticated use of shale drilling technology that allows it to access oil reserves that might not be profitable for other firms to access. This technology also allows the company to significantly slow the decline in shale wells which is a common problem for competitors and leads to high ongoing capital expenditures to keep oil production steady, let alone grow it. EOG’s focus on lean operations has also allowed it to reduce drilling times and optimize well production. In total, EOG has steadily reduced its cash operating cost per BoE from $13.53 to $10.47 in Q4 2022.
- Strong Balance Sheet
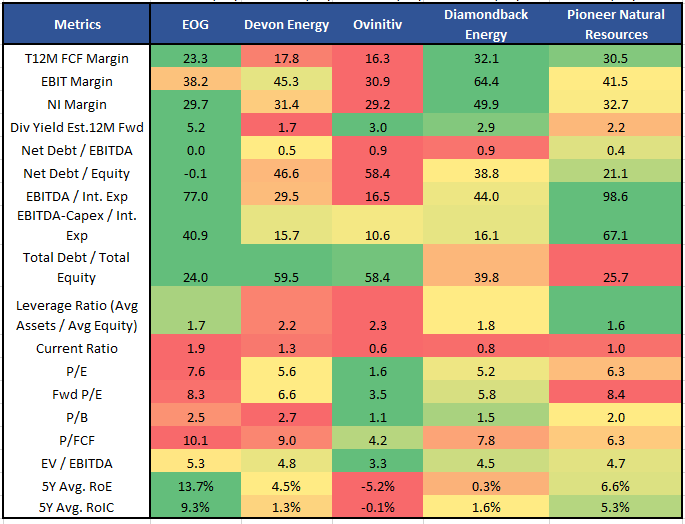
EOG’s superior capital efficiency as indicated by its favorable debt ratios as well as its inventory and supply chain management make the company stand out from its peers. With a net-debt-to-equity ratio of 3.1% vs. 46% and 48% for Devon and Diamondback Energy, respectively, we believe that EOG will be able to enjoy more operational flexibility and take on more debt at lower rates than peers should the economic environment worsen while still providing plenty of assurance to creditors and investors that default risk is minimal. EOG also has the highest interest rate coverage among its peers as measured by EBITDA to interest expense (see table below). Despite the current economic environment of rising interest rates and high risk of recession (and lower oil prices), EOG’s balance sheet and operational efficiency indicate that it is well-positioned to cover all interest and debt payments even in the event of a significant fall in oil prices.
- Continued First Mover Advantage
EOG is well known for regularly being the first to explore undeveloped lands and adopting new drilling and production techniques that differentiate the company from its peers. This ability to consistently find new profitable fields is also in large part due to the superior skill and expertise of EOG’s management in shale oil production which has been developed by retaining talented executives over several years, if not decades, and promoting from within the company. EOG is again demonstrating its ability to move quickly in its new Utica and Dorado production sites, making the company one of the very few oil companies expected to increase production over the next 3 years.
Peer Group Comparison
We selected four competitors that are in our view closest to EOG in terms of their geographical location of operation (U.S. market) and similarity in revenue mix (oil and gas focus).
The below table highlights that EOG outshines its peers on all relevant metrics, most importantly profitability metrics such as higher RoE and operating margins, and balance sheet metrics like net debt to equity. Especially the stable balance sheet of EOG with the lowest net debt level amongst peers gives us confidence that EOG will have a sufficient margin of safety in the event of a stark deterioration in global oil prices. Low debt levels provide the firm with ample flexibility to keep returning capital to shareholders while still making the necessary investments into its business, without jeopardizing the creditworthiness of the company. Although EOG trades a premium to its peers based on P/E and P/B metrics, we believe that first, this premium is justified, and second, prefer to focus on the EV/EBITDA valuation on which EOG is attractively priced relative to peers given its low debt levels.
Valuation
As with all our reports, we do not provide target prices or provide buy or sell recommendations. Instead, we aim to provide readers with a framework that they can use to form their own opinion on what a realistic estimate of intrinsic value might look like for them.
When valuing a company that has seen a recent outsized jump in earnings it is important to avoid starting the DCF from record-level earnings and then extrapolate those elevated earnings into the future. In our 10-year DCF framework, we therefore used consensus revenue estimates for the next three years and then assumed that revenue declines to a long-run trend of $21bn from currently $25.7bn (trailing 12-months as of Sept. 30). Our first-year revenues are the therefore the highest in the entire model. We then employ a very conservative assumption that we earn the 5-year average EBITDA margin (42.6%) every year although a more realistic assumption would be to start at current EBITDA levels of ~54% and gradually decline to the mean. Using consensus estimates and long-term averages for depreciation, capital expenditures, and taxes, we calculate FCFs ten years out. We use a 0% growth rate to determine the terminal value because we cannot assume that a finite resource can grow indefinitely into the future, but note that it may still be reasonable to use a minor growth rate of up to 0.5% as the oil supply is not expected to deplete over the next several decades. We highlight ranges of discount rates in the table below and leave the reader to decide which he prefers to use. The oil industry and its analysts commonly use 10% as the discount rate in their models so this rate can be seen as the industry standard. The highlighted 7.5% to 8.5% range would include our realistic estimates of the cost of equity that could be used to calculate the equity value. As readers of our other reports well know, we like to highlight the discount rate that Warren Buffet has been said to use, which is the rate of the long-term U.S. Treasury rate plus some premium of a few percentage points. We thus highlighted a 6.5% discount rate, which would equate to the 10-year yield of ~3.5% plus an equity risk premium of 3%.
At the 0% terminal growth level, EOG’s intrinsic value is estimated to be above its current market cap of $61.6bn for all discount rates shown below. The margins of safety for the 6.5%, 8%, and 10% we highlight are 43.4%, 30.7%, and 13.3%, respectively.
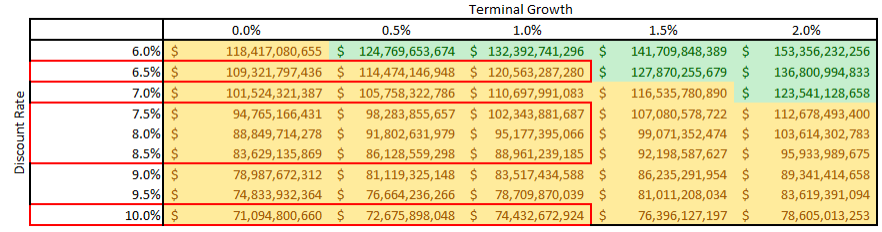
The green-colored cells indicate intrinsic values more than 2x the current market cap. Yellow cells are between 1.5x and 2x current market cap.
Risks
The three main risks to consider in our view are as follows:
1. Commodity Price Risk
The profit of any company operating in the E&P industry depends almost exclusively on the price they can sell their oil and gas supply for. As the price is determined by market supply and demand, is outside of the control of any single company, can fluctuate strongly from one year to another, investors are faced with constant revenue and earnings uncertainty. Although EOG and most companies use financial derivatives to hedge some of this price fluctuation these hedging efforts are on average unprofitable for firms and detract from overall profits. The only way to deal with price fluctuations effectively is by maintaining the lowest possible cost structure so investors can still receive some amount of profits during times of low oil prices. We believe that EOG has proven its capability to maintain its profitability during such times. When valuing and potentially investing in EOG, investors are well-advised to make prudent assumptions as to the price of oil that can be achieved in the future as opposed to extrapolating current record-level prices into the future.
2. Operational Risk
The success of E&P companies also depends on their ability to consistently search for and develop new oil fields that are economically viable as older drilling sites are depleted. Failure to do so would lead to soaring dry well expenses and mounting losses in the company’s financial statements. According to E&Ps most recent quarterly reports, management believes the company currently has the strongest reserve inventory in company history and plans to expand its strong position. This signals to us that this risk is not of concern in the near-term but must be constantly monitored as current reserves are depleted.
3. Transition to Carbon-Neutral Economy & Regulation
This risk can be split into two related risks. One is the speed at which renewable energy sources are developed and becomes available and the other is the amount of new regulation that is likely to be passed to reduce the oil industry’s environmental impact. The former depends on the advancements of science and economic viability of alternative energy technology, while the latter is mostly a function of political sentiment in key oil markets. While these developments are impossible to predict several years into the future, we believe that it is likely that environmental regulation in Europe, and to a lesser degree in the U.S., will tighten and make energy operations in those regions more difficult. This is, in our view, the largest risk facing the sector as increased regulation and taxation could severely impact profits over the medium-term if legislators decide to accelerate their transition toward a carbon-neutral economy before EOG and peers have successfully established alternative revenue sources.
Conclusion
Summarizing all the points above, EOG is a cost-leader in the E&P industry with a strong balance sheet and a competitive advantage in shale drilling technology that allows the company to outrank its peers on several key metrics such as RoIC, margins, and interest coverage. Further, EOG is selling below our estimates of intrinsic value but falls short of delivering a 50% margin of safety and therefore requires further analysis in order to minimize the chance of potential permanent loss of capital or more patience to wait until a lower price provides a sufficient margin of safety for one’s investment.
Contact us if you want to learn more about our latest views on EOG or our other market insights.
Disclosure: This report is designed for a hypothetical long-term investor who is unfamiliar with EOG and is interested in buying and holding the company for at least 10 years. As such, this report ignores short-term macroeconomic forecasts and fluctuations in the business cycle, avoids market timing recommendations, and maintains conservative assumptions to avoid loss of principle by overpaying for the business. Past performance is not indicative of future performance and should not be relied upon to make investment decisions. This article is neither financial advice nor a recommendation to buy or sell securities.