Aligning Your Asset Allocation with Your Inflation Views
For the past two years, Wall Street has been captured by the discussion of one omnipresent topic: the risk of inflation.
After more than a year of seemingly limitless money printing, bond purchases, and stimulus checks, global markets spent the majority of 2021 debating how serious the threat of a surge in inflation might turn out and how long, if at all, it could last. Market participants, regulators, and government officials rigorously assessed whether inflation would far exceed the Fed’s target of 2% annually and what share of inflation increase could turn out as transitory one-time effects as opposed to more permanent shifts in inflation expectations. With the benefit of hindsight, investors in 2023 now know for sure that inflation did not turn out to be transitory and its risks had been gravely understated.
Much has been written about inflation in the recent past and we will certainly not be the last to write about this topic. As such, the goal of this article is not to present yet another opinion on how high or low inflation may be at the end of the year. Instead, we will focus on an area of discussion that has undeservingly fallen out of the spotlight in public commentary, namely the question of how different asset classes perform during inflationary times and how to select an asset allocation that is in line with your view on inflation. We provide three asset allocations based on 48 years of data and test how they would have performed in the inflationary regime of the 1970s.
Asset Class Performance in Times of Inflation
The economy follows expansionary and recessionary cycles that have well-researched implications for a portfolio’s target asset allocation. As depicted in figure 1, equities are attractive in high growth and low inflation regimes, while bonds are especially attractive in recessionary periods of low growth and declining inflation. As either of these scenarios is the most frequently observed status in the market, a pure equity portfolio or a traditional 60/40 portfolio do well most of the time. However, during stagflation regimes marked by low growth and high inflation both bonds and equities perform poorly resulting in negative real returns for the 60/40 portfolio.

In his most recent article, Harvey Campbell, Professor of Finance at Duke University, calculated the real returns of all major asset classes during inflationary and non-inflationary regimes over the past 94 years and found that only very few asset classes offer real protection against inflation and that most portfolio managers have more risk exposure to inflation than they think.
Specifically, bonds and equities provide -5% and -7% respectively during times of high inflation[1]. The energy sector is the only equity sector that is able to provide a small positive real return (+1%). Further, residential REITs, often believed to hedge inflation well, have returned -2% during inflationary times in real terms. Though TIPS and gold do offer some inflation protection (+2%, +13%), Campbell suggests that TIPS are an expensive vehicle to hedge inflation while gold is an unreliable hedge because of its high volatility. Campbell’s data suggest that commodities, specifically energy commodities are the most successful asset to protect against inflation yielding +14% in real terms for aggregate commodities and +41% for energy commodities.
Creating a Multi-Asset Portfolio That Matches Your Inflation View
Considering these findings and the ongoing inflation debate, the question to answer thus becomes how to construct an asset allocation that matches one’s expectation for future expectations. It is not our intention to present our own inflation, but rather present the reader with options on how to allocate between different asset classes to generate returns that are in line with his view on inflation. For this purpose, our team used returns of all major asset classes over the past 24 years to create three exemplary portfolios to demonstrate how the choice of different asset weights severely impacts portfolio returns during inflationary and non-inflationary times compared to a traditional 60/40 portfolio.[2]
The Inflation Neutral Portfolio
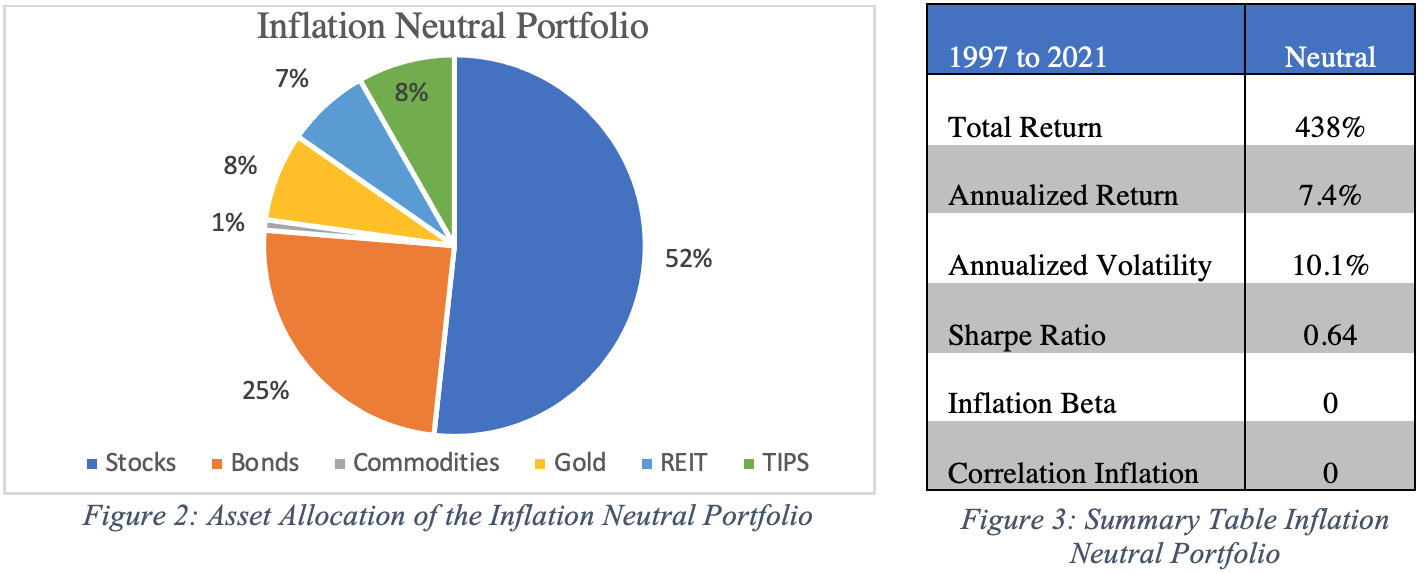
Based on asset returns since 1997 and their respective correlations, we optimize the portfolio weights such that its returns have a zero correlation with changes in inflation which subsequently results in a zero beta to inflation as well. During times of low to moderate inflation, this portfolio is virtually unaffected by inflationary surprises in either direction. Neutralizing exposure to inflation also results in the beneficial effect of additional diversification across asset classes compared to the traditional portfolio and yields a higher Sharpe Ratio of 0.64 instead of 0.58. As one would expect from Campbell’s analysis, the inflation-neutral portfolio reduces its exposure to stocks and bonds because both asset classes perform poorly during times of inflation and substitutes them with slightly positive inflation assets such as TIPS and gold. Not that our optimization only suggests a very small allocation to commodities as it has a very strong positive correlation and high beta to inflation which would tilt the portfolio’s exposure too much in favor of inflation increases.
The High Correlation Inflation Portfolio

If an investor has a strong conviction that the risk of inflation is high, he might choose to benefit from a future surge in inflation by increasing the allocation to inflation assets. Similar to our previous example, we optimize the portfolio allocation such that it maximizes the correlation to changes in inflation. However, we add one additional constraint: we specify that the Sharpe Ratio of the portfolio cannot fall below 0.4 (about 10% deviation from the long-term equity market Sharpe Ratio) to avoid extreme and undiversified results. In line with Campbell’s findings, our unconstrained maximization of inflation correlation would yield a portfolio that is 100% invested in commodities and has a Sharpe Ratio of -0.17. As expected, the inflation portfolio has performed poorly over the past 24 years as markets have only experienced modest or mostly low levels of inflation leading to underperformance of inflation assets.
The Negative Correlation Inflation Portfolio

If an investor takes the opposite view and believes inflation will decrease to very low levels in the future, he might choose to shift his allocation towards assets positively affected by low inflation such as nominal bond yields. Similar to the previous example, an unconstrained minimization of inflation correlation would yield the undiversified result of a 100% allocation to bonds as this asset class is most sensitive to decreases in inflation. We, therefore, add there add the constraint that bonds cannot exceed 50% of the portfolio. This constraint diversifies the portfolio and increases its performance and volatility, hence the Sharpe Ratio from 0.67 to 0.75.
We summarize the performance of each portfolio and compare it to the 60/40 portfolio in figures 8 and 9. The diversified low correlation portfolio is not very different from the 60/40 portfolio as the traditional 60/40 allocation already has a negative exposure to inflation, hence demonstrating why most traditional asset managers are generally ill-prepared for increases in inflation and underestimate its severely negative implications for their portfolio’s performance as we exemplify in the following segment. Although the high correlation portfolio underperforms over the 24-year period, it is noteworthy that it outperforms its peers from 1997 until the financial crisis of 2008 and then severely underperforms as a result of a prolonged low-inflation regime in the years following the crisis.

Portfolio Performance During Inflationary Regimes
After optimizing the portfolios for different views on inflation, we test how they would have performed during the inflationary regimes of the 1970s and early 1980s, a nine-year period in which YoY CPI was below 5% for only two months and averaged 8.1%.
As expected, the high-correlation portfolio significantly outperforms all other portfolios. During the two inflationary spikes in 1974 and in 1980, the portfolio outperforms by more than 60% in 1974 and by more than 180% in 1980 and is also the only portfolio to provide a positive real return in the entire nine-year period. Surprisingly, the “neutral” portfolio is not able to withstand the inflationary pressure and displays a significantly negative correlation to inflation due to its high weight in stocks and bonds. Though it is well balanced in times of modest and low inflation the neutral portfolio does not include enough inflation assets to counteract the uncontrolled levels of inflation in the 70s. We find it especially troubling that correlations and betas to inflation for all portfolios increase significantly compared to non-inflationary times thereby demonstrating the urgency for investors to correctly forecast inflation regimes.
The 60/40 portfolio experiences the worst performance, underperforming even the negative correlation portfolio.[1] This concerning performance highlights once again the uncontrolled risk traditional 60/40 investors are accepting by not holding a view on inflation at all or by failing to allocate portfolio weights to adequate inflation assets such as energy commodities. Further, delivering negative real returns over a nine-year period could quickly deplete AUMs of most active funds as investors withdraw funds and seek inflation-protected alternatives which underline the importance for managers to accurately monitor inflation and invest accordingly.


Conclusion
We have shown that while the high correlation portfolio significantly outperforms during times of uncontrolled inflation, it also performs significantly worse than its peers during normal times which is why we believe it to be imprudent to select any single strategy and hold on to it during all types of regimes. Especially because our examples have only been calibrated to match inflation while completely ignoring other important factors such as GDP and earnings growth. Instead, we believe an active strategy, in which weights of inflation and non-inflation assets are dynamically adjusted based on the inflationary environment is necessary if one wants to perform well during all inflation regimes. However, any active inflation strategy requires the ability to reliably and accurately forecast changes in inflation. Hence, in absence of such forecasting ability, we believe that a pure-beta risk-parity approach to investing might be a reasonable alternative to generate stable returns during all types of market conditions. Both of these strategies will be presented in more detail in our next letter.
Lastly, we conclude that inflation is a severe, and often underestimated, risk to any portfolio and requires more attention than most traditional managers account for leaving them unreasonably exposed and too late to act. Though we do not present our view on future inflation in this letter, we demonstrate the importance of having such a view in order to construct a forward-looking asset allocation that is able to benefit from regime shifts. Not forming an opinion on inflation may result in underperformance and negative real returns, especially during periods of high inflation.
[1] The article defines the beginning of an inflationary regime when YoY CPI is above 5% and ends at the point at which YoY CPI reaches its peak without having fallen below 50% of its maximum annual rate in rolling 24-month observation windows.
[2] We point out that the portfolio correlations to inflation are generally very weak as inflation is only one of several factors influencing asset returns, with growth being the strongest factor on average.
[3] The negative correlation portfolio would have displayed the worst performance if we allowed it to include 100% bonds as suggested under the unconstrained optimization.